how_to:graphicalplotpeptides
How to generate a graph (histograms, plots, ...) on peptides features
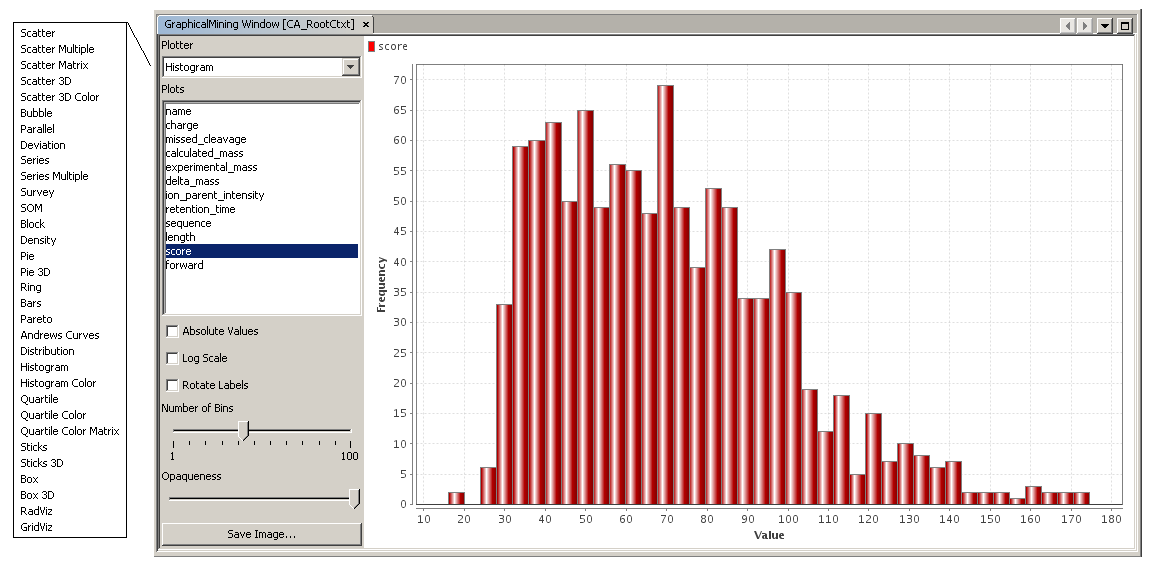
With hEIDI, you can easily plot a graphical representation of the peptides contained in one more more contexts.
You can choose the type of plot the most appropriate to your needs (histogram, scatter plot or matrix, parallele, bubble plot, etc).
To generate a plot, select one or more context and click MS Identification>Context>Visualize. A blank plot appears and you can then choose the plot and the attributes to display.
![]() For technical reasons, hEIDI can only represents peptides associated with contexts that are already saved in the MSI database. If you want to visualize a newly created context you must save it back to the database before visualizing it.
For technical reasons, hEIDI can only represents peptides associated with contexts that are already saved in the MSI database. If you want to visualize a newly created context you must save it back to the database before visualizing it.
how_to/graphicalplotpeptides.txt · Last modified: 2010/01/04 17:02 by 132.168.74.230


