Table of Contents
Context comparisons
Definition
The purpose is to search for similar protein groups, i.e. protein groups:
- having the same set of proteins
- identified by a same set of peptides
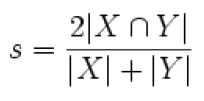
The Dice coefficient is used to measure similarity (result ranges from 0 to 1).
Details about comparison result view
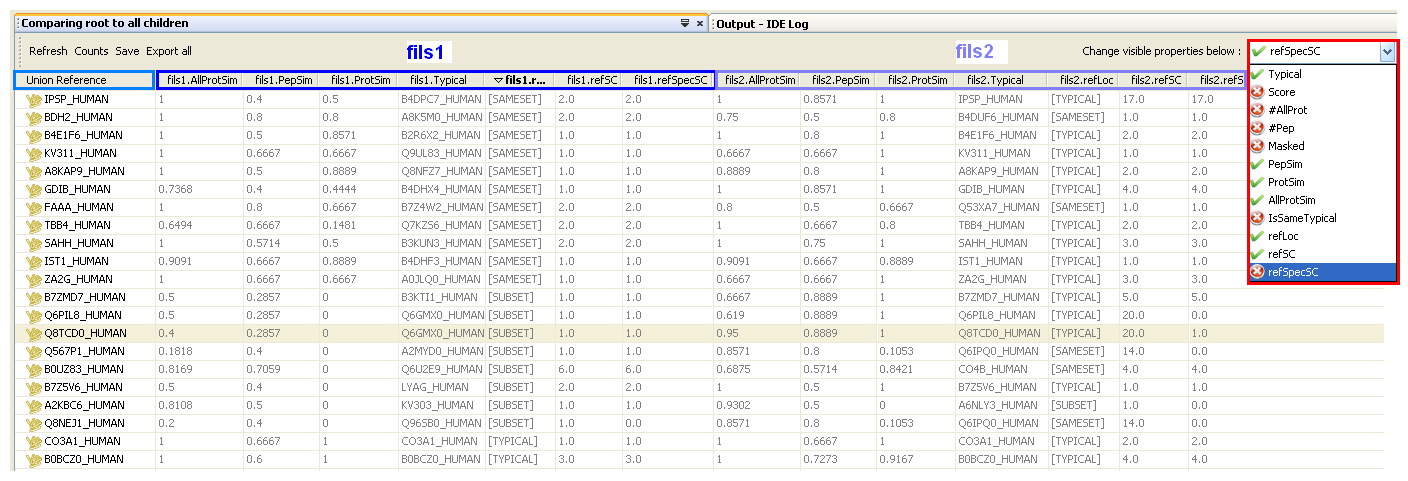
When the comparison algorithm execution is finished, the comparison result is displayed in a tab.
The most left column (“Union reference”) displays the reference protein groups (master protein accession) from the union parent context (it may be a virtual context).
For each protein group of the Union Reference context, the table displays the most “similar” protein group in each compared contexts.
For each compared context a default set of properties are displayed. You can change them by selecting/deselecting items in the droplist (right side).
Comparison result view
- ProtSim: similarity on the samesets of proteins of the two protein groups
- AllProtSim: similarity on the samesets and subsets of proteins of the two protein groups
- PepSim: similarity on peptides of the two protein groups
- isSameTypical: indicates if the typical protein is the same between the two protein groups
- Typical: the accession of the master protein group
 NEW refLoc: possible values are [TYPICAL], [SAMESET], [SUBSET] or []. This indicates where the reference protein accession is seen in the compared protein group.
 - [TYPICAL] means the reference accession is seen in the compared protein group as the typical protein
- [SAMESET] means the reference accession is seen in the compared protein group as a sameset protein
- [SUBSET] means the reference accession is seen in the compared protein group as a subset protein
- [] means the reference accession is not seen in the compared protein group. In this case, ProtSim = 0 and pepSim > 0.
 NEW refSC: the spectral count of the reference protein accession in the compared protein grouped.
  No need to run previously the spectral count on the context.
 NEW refSpeSC: the specific (proteotypic) spectral count of the reference protein in the compared protein group.
  No need to run previously the spectral count on the context.
- Score: score of the compared protein group
- #Pep: number of peptides of the compared protein group
- #AllProt: number of proteins in the compared protein group.
- 'X(Y,Z)' means a total of X proteins for the whole protein group (X=Y+Z) with Y sameset proteins and Z subset proteins
Compare several contexts to their union
Main steps realized in the comparison process:
- Retrieve selected contexts to compare
- Know if they are all the children of an existing parent context. If not, create a virtual union parent context (see details in following section) that groups selected contexts and run peptide/protein grouping
- Compare selected contexts to their union (virtual or existing parent)
Is there a need to create a "virtual" union parent context ?
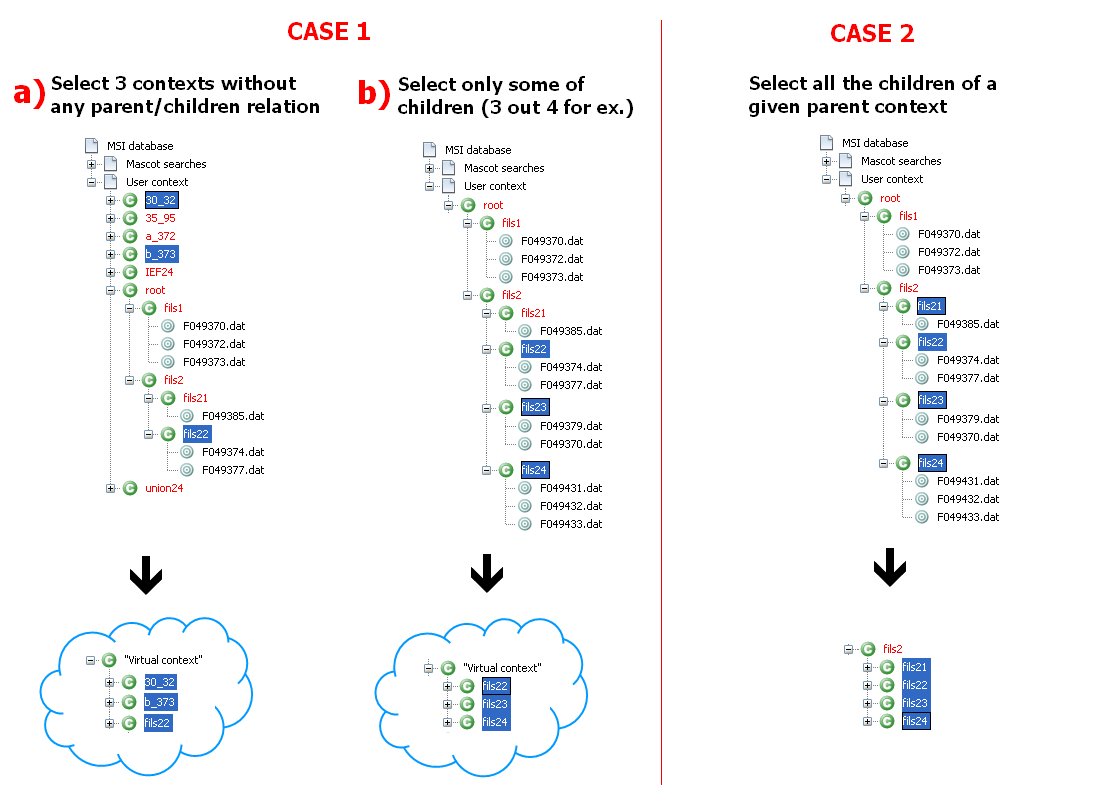
There are 2 situations, either the parent union already exists or the parent union needs to be created. In the image below:
- A *virtual* union parent context must be created in case 1 (the virtual context has no persistence in MSI database, it is only created in-memory for the process)
- The union parent context already exists in case 2
Compare union parent context to each children
The algorithm will then compare every protein groups of the union parent context to every protein groups of each children context in order to find the best alignment.
Comparing two protein groups each other means:
- Checking the similarity of their peptide sets
- Checking the similarity of their protein sets (sameset and subset)
Case 1: if a Protein Group (context1) is compared to the 2 following Protein Groups (Context2), PG2 will be preferred
| PG1 | PG2 | |
|---|---|---|
| peptideSimilarity | 0.2 | 0.5 |
| proteinSimilarity | 0.4 | 0.6 |
| AllProtSimilarity | - | - |
Case 2: if a Protein Group (context1) is compared to the 2 following Protein Groups (Context2), PG2 will be preferred
| PG1 | PG2 | |
|---|---|---|
| peptideSimilarity | 0.5 | 0.5 |
| proteinSimilarity | 0.4 | 0.6 |
| AllProtSimilarity | - | - |
Case 3: if a Protein Group (context1) is compared to the 2 following Protein Groups (Context2), PG2 will be preferred
| PG1 | PG2 | |
|---|---|---|
| peptideSimilarity | 0.5 | 0.5 |
| proteinSimilarity | 0.6 | 0.6 |
| AllProtSimilarity | 0.5 | 0.6 |
Case 4: if a Protein Group (context1) is compared to the 2 following Protein Groups (Context2), PG2 will be preferred
| PG1 | PG2 | |
|---|---|---|
| peptideSimilarity | 0.0 | 0.0 |
| proteinSimilarity | 0.6 | 0.8 |
| AllProtSimilarity | - | - |
Why/What means High/Low peptide/protein similarities
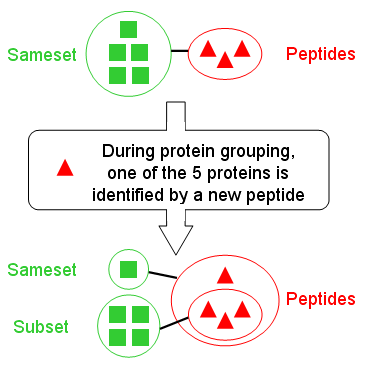 When comparing two protein groups using “Protein” and “Peptide” similarity criteria, you can get four main situations:
| Low Protein similarity | High Protein similarity | |
|---|---|---|
| Low Peptide similarity | Proteins groups are not alike | We have identified the same proteins but with different peptides (rare) |
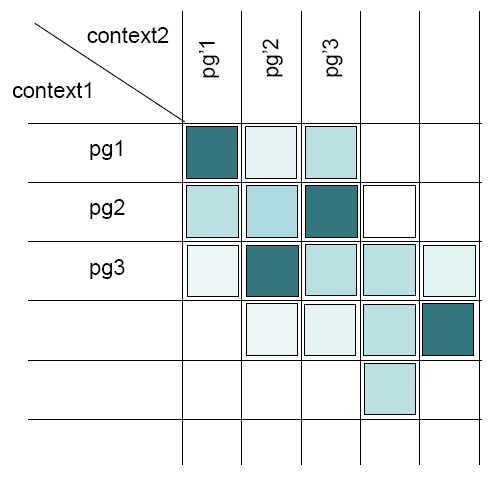
| High Peptide similarity | See image (on the left) to have an example of how to get this situation. It's usefull to check the “All Protein” similarity to have an information on proteins in subset | protein group are alike |
