Table of Contents
LC-MS quantification
Different strategies for quantitative analysis
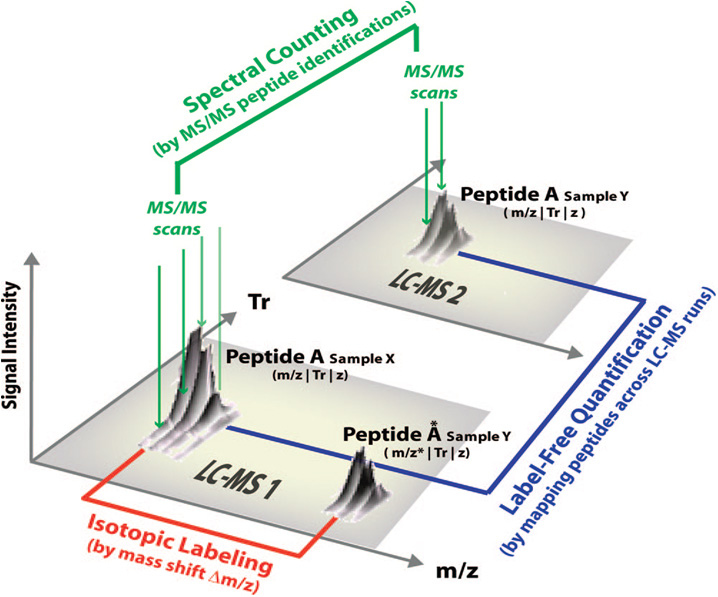
Although 2D-gel analysis has been a pioneer method in this field, it has been gradually replaced by nanoLC-MS/MS analysis allowing nowadays to quantify a larger number of proteins and allowing their identification. Quantification is made on thousands of species and requires new and adapted algorithms for the processing of complex data. Two major strategies are available to perform nanoLC-MS/MS relative quantification: strategies based on isotopic-labeling of peptides or proteins in one of the compared conditions, and label-free based strategies that can be analyzed in different ways. There are usually three types of LC-MS/MS data analyses (cf. figure 1):
- Extraction of a couple of MS signals detected within a single analysis when using a isotopic-labeling strategy
- Counting and comparing the number of fragmentation spectra (MS/MS) of peptides from a given protein detected in parallel analysis (“Label-free quantitation based on spectral-counting”),
- Extraction, alignment and comparison of the MS signal intensities from the same peptide detected in parallel analysis (“Label-free quantitation based on LC-MS signal extraction”).
 |
| Figure 1: Main view of different approaches of LC-MS/MS quantitative analysis. (Mueller, Brusniak et al. 2008) |
|---|
At first nanoLC-MS/MS quantitative analysis has been made using isotopic-labeling strategies. Labelling molecules facilitates the relative quantification of two conditions in the same nanoLC-MS/MS run. According to the theory of stable isotope dilution, a isotopically-labelled-peptide is chemically identical to its unlabeled counterpart. Therefore both peptides behave identically during chromatographic separation as well as mass spectrometric analysis (from ionization to detection). As it is possible to measure the difference in mass for the labeled and unlabeled peptide with mass spectrometry, the quantification can be done by integrating and comparing their corresponding signal intensities (cf. figure below).
Isotopic labeling strategies are very efficient but limited by the maximum number of samples that can be compared (eight samples at most for an iTRAQ 8plex labeling), the cost or the constraint due to the introduction of the label. The development of high-resolution instruments, such as the LTQ-Orbitrap, has enabled the development of label-free quantification methods. This methodology is easy to implement as it is no longer necessary to modify the samples, it allows an accurate quantification of the proteins within a complex mixture, and it considerably reduces the cost of the analysis. An LC-MS/MS acquisition can be seen as a map made of all the MS spectra generated by the instrument. This LC-MS map corresponds to a three-dimensional space: elution time (x), m/z (y) and measured intensity (z).
Analyzing MS data can be done in several ways:
- Un-supervised approach: it consists of detecting peptide signals from a LC-MS map (cf. figure 3 below). The detection is done by first using peak picking algorithms, then grouping together the peaks that correspond to a same peptide, at the same time on the m/z scale (different isotopes of an isotopic profile and different charge states of a peptide) and on the elution time scale (detected isotopic profiles of the peptide on different consecutive MS spectra all along its chromatographic elution). This process depends on the comparison of experimental data and theoretical known models of isotopic distribution and peptide chromatographic elution. The purpose of this analysis is to find a list of features corresponding to all the signals for a single peptide ion with their corresponding coordinates. The identification of these peptides can be done from the MS/MS spectra matching these features, or using a targeted approach in a second acquisition, or with a database of a set of previously identified peptides containing information such as the peptide sequence, mass and elution time. This third method is called “Accurate Mass and Time Tags” or AMT (Smith, Anderson et al. 2002).
- Supervised approach: the coordinates (x, y) of the peptidic signals to extract are known (or predicted). In an LC-MS experiment, the MS signal intensity of an peptide eluting from the chromatographic column can be monitored (cf. figure 4). The area under the curve of the chromatographic peak is the extracted ion current (XIC, also called extracted ion chromatogram) and it is proportional to the peptide’s abundance in the sample. Indeed it has been proved that the XIC is linearly dependant of the quantity of the peptide (Ong and Mann 2005). Therefore the signal analysis consists of extracting the intensity of the signal at a specific coordinate on the LC-MS map and giving the corresponding XIC.
The first approach is more exhaustive than the latter as it can find quantitative information on peptides that may not have been fragmented by the mass spectrometer. About the second approach, we can only assume that knowing the peptide’s exact monoisotopic mass should reduce the probability of making mistakes in the quantification, but no study to our knowledge has proved it so far. In a comparative quantitation analysis, both approaches require the matching of the extracted signals (cf. figure 5). To do this, the LC-MS Maps have to be previously aligned in order to correct the variability coming from the peptide’s chromatographic elution. Indeed the difference for the elution time of a given peptide in two LC-MS analysis may reach tens of seconds. Even if a peptide mass can be precisely measured, it is still possible that peptides with very close m/z elute at the same time frame. Figure 3 shows how important the density of the measures is. Therefore, comparing LC-MS maps without aligning their time scale would generate many matching errors.
Different algorithms have been developed to correct the time scale and are usually optimized for a given approach. Supervised method benefits of the knowledge of the peptide identification and thus will be able to align maps with a low error rate. More data processing will be needed to obtain quality quantification results. Read the “LC-MS quantitation workflows” documentation to get more information about LC-MS quantification algorithms in Proline.


